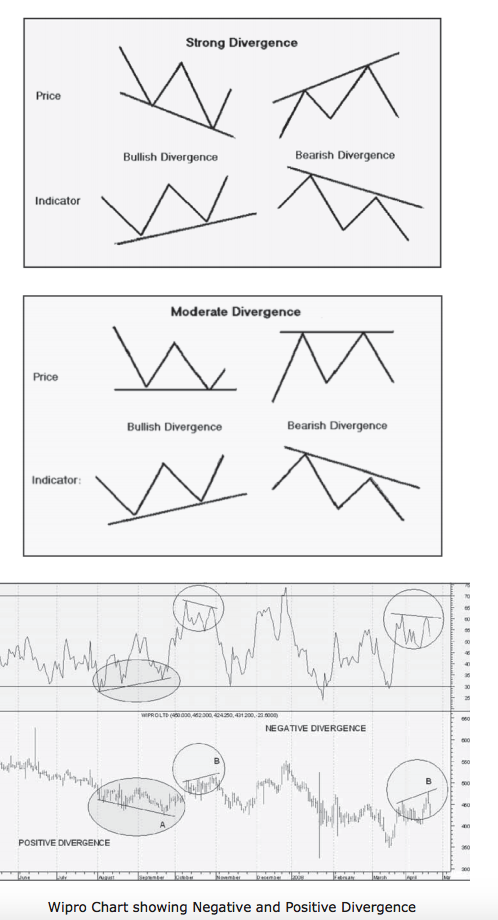
The other means of using RSI is to look at divergences between price peaks/troughs and indicator peaks/ troughs.
If the price makes a new higher peak but the momentum does not make a corresponding higher peak this indicates there is less power driving the new price high. Since there is less power or support for the new higher price a reversal could be expected.
Similarly if the price makes a new lower trough but the momentum indicator does not make a corresponding lower trough, then it can be surmised that the downward movement is running out of strength and a reversal upward could soon be expected. This is illustrated in the chart below. A bullish divergence represents upward price pressure and a bearish divergence represents downward price pressure.

• The fi rst divergence shows a new lower trough forming at point ‘A’ but the RSI oscillator does not reach a new lower trough. This indicates the downward movement is exhausting
and an upward move is imminent.
• The second and third are a bearish divergence with a new sharply higher peak formed at ‘B’ but it is not supported by at least an equal high in the RSI, hence a downward move
is expected.
